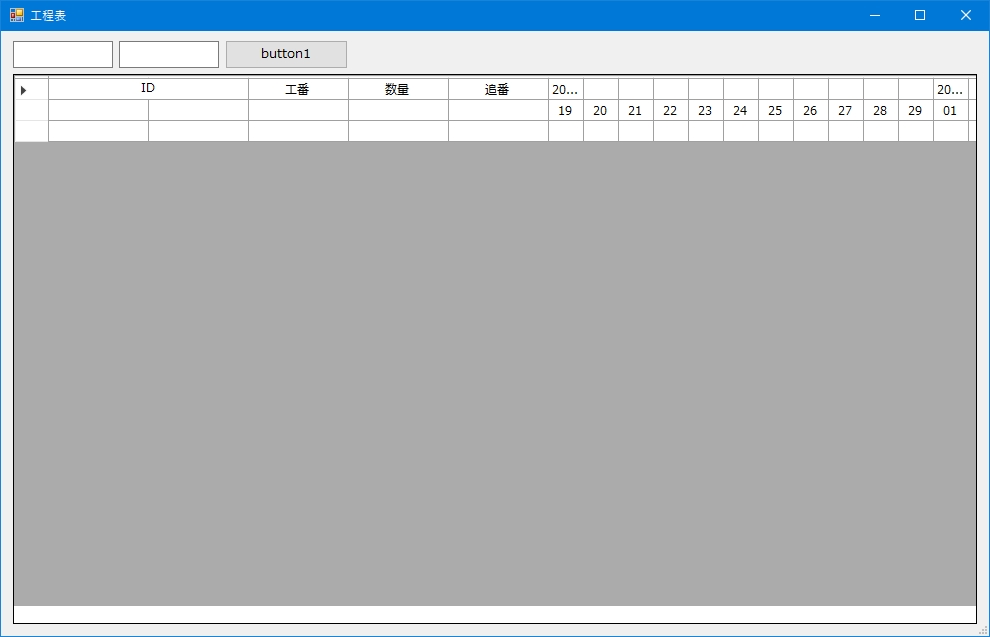
今回は標準ヘッダーを利用せず1行目2行目をヘッダーとして利用しており、試しに1行目の1列目2列目を擬似的結合してみた。

どこのサイトもだいたい同じ説明をしていて、CellPainting()で処理するのが基本という感じ。ちょっとつまづいたのが標準描画(セルの背景色とか文字列とか)で疑似的結合のRetangleが隠れてしまう現象で、回避するためにはe.Handled = trueで標準描画をキャンセルする必要があった。
例えば今回は利用しないけど、標準描画の一部をキャンセルする場合、e.Paint()で標準描画を呼び、e.Handled = trueで終了させる。
var p = e.PaintParts & ~DataGridViewPaintParts.Border;
e.Paint(e.ClipBounds, p);
e.Handled = true;
これでBorderの描画がキャンセルされる。
|
1 2 3 4 5 6 7 8 9 10 11 12 13 14 15 16 17 18 19 20 21 22 23 24 25 26 27 28 29 30 31 32 33 34 35 36 37 38 39 40 |
DataGridView.CellPainting += (s, e) => { if (e.RowIndex != 0) return; // Rows[0]のみ if (e.ColumnIndex == 1) { e.Handled = true; // e.Handled = trueで描画をキャンセルできる。 // 描画をキャンセルしたセルのみRectangleの描画が優先される。 // ここでColumns[1]の描画をキャンセルしないと // Columns[0]の描画が後ろになってしまう。 // DoubleBufferedが有効の場合スクロールなどで画面外になったときの // Columns[1]の黒塗領域が直らない。 } if (e.ColumnIndex == 0) { DataGridView dgv = (DataGridView)s; Rectangle newRect = new Rectangle( e.CellBounds.X-1, e.CellBounds.Y-1, e.CellBounds.Width + dgv.Columns[e.ColumnIndex+1].Width, e.CellBounds.Height); e.Graphics.FillRectangle(Brushes.White, newRect); e.Graphics.DrawRectangle(new Pen(dgv.GridColor), newRect); StringFormat sf = new StringFormat(); sf.Alignment = StringAlignment.Center; sf.LineAlignment = StringAlignment.Center ; e.Graphics.TextRenderingHint = TextRenderingHint.ClearTypeGridFit; e.Graphics.DrawString(e.Value.ToString(), e.CellStyle.Font, Brushes.Black, newRect, sf); e.Handled = true; } }; |
***
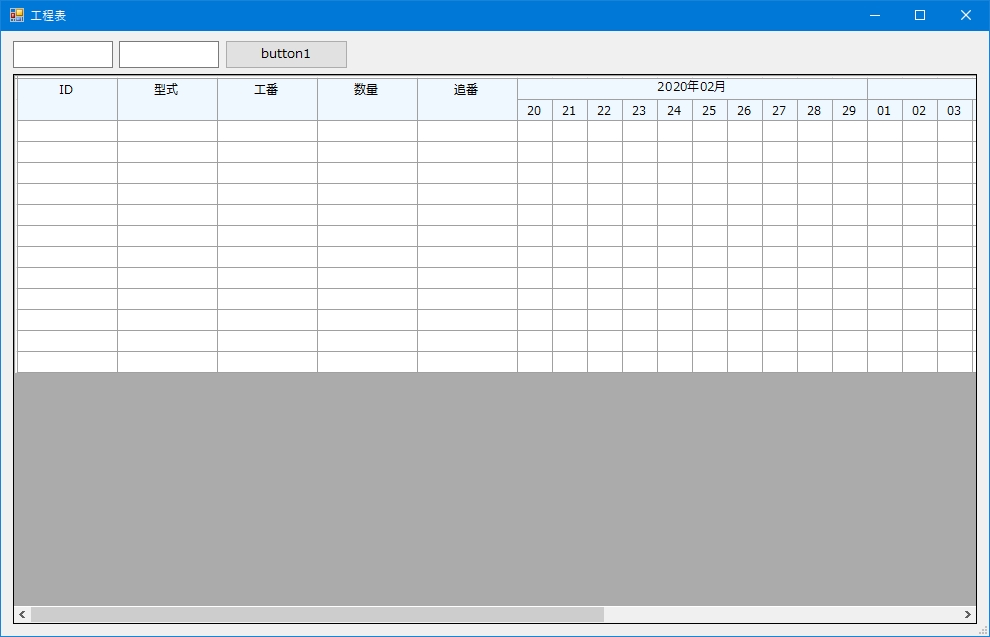
次は擬似的結合の範囲をループで動的に取得してみた。1行目1~5列目までは罫線Bottomを消すだけで、それ以降の1行目6列目以降(年月の部分)を疑似的結合している。

描画セル(1行目6列目)が画面から消えない(見えなくなることがない)作りならこれで問題ないのだけど、横スクロールなどで描画セルが画面から消えると疑似的結合のRectangleも消えて黒塗りになってしまうという厄介な問題が発生する。
スクロールの状態から描画セルを修正するような計算をすれば回避できるかもしれないけど、かなり面倒だしCellPainting()は頻繁に呼ばれているので、あまり複雑な計算もしたくない。
|
1 2 3 4 5 6 7 8 9 10 11 12 13 14 15 16 17 18 19 20 21 22 23 24 25 26 27 28 29 30 31 32 33 34 35 36 37 38 39 40 41 |
DataGridView.CellPainting += (s, e) => { if (e.RowIndex != 0) return; // 1行目のみ if (e.ColumnIndex < _StartDateColumn) { // 罫線非表示 e.AdvancedBorderStyle.Bottom = DataGridViewAdvancedCellBorderStyle.None; } else if (e.ColumnIndex >= _StartDateColumn) { if (Convert.ToString(e.Value) == "") { e.Handled = true; // 通常の描画を呼ばない。 } else { DataGridView dgv = (DataGridView)s; int totalWidth = 0; int c = e.ColumnIndex; do { totalWidth += dgv.Columns[c].Width; c++; } while (c < dgv.Columns.Count && Convert.ToString(dgv.Rows[0].Cells[c].Value) == ""); Rectangle rect = new Rectangle(e.CellBounds.X - 1, e.CellBounds.Y - 1, totalWidth, e.CellBounds.Height); e.Graphics.FillRectangle(Brushes.AliceBlue, rect); e.Graphics.DrawRectangle(new Pen(dgv.GridColor), rect); var stringFormat = new StringFormat(); stringFormat.Alignment = StringAlignment.Center; stringFormat.LineAlignment = StringAlignment.Center; e.Graphics.TextRenderingHint = TextRenderingHint.ClearTypeGridFit; e.Graphics.DrawString(e.Value.ToString(), e.CellStyle.Font, Brushes.Black, rect, stringFormat); e.Handled = true; // 通常の描画を呼ばない。 } } }; |
***
ちなみに、CellPainting()ではなくPaint()で処理することもできる。イベント引数からCellBoundsを取れないので、直接DataGridViewで指定するだけ。
|
1 2 3 4 5 6 7 8 9 10 11 12 13 14 15 16 17 18 19 20 21 22 23 24 25 26 27 28 |
DataGridView.Paint += (s, e) => { DataGridView dgv = (DataGridView)s; int totalWidth = 0; int c = 5; do { totalWidth += dgv.Columns[c].Width; c++; } while (c < dgv.Columns.Count && Convert.ToString(dgv.Rows[0].Cells[c].Value) == ""); Rectangle rect = new Rectangle( dgv.GetCellDisplayRectangle(5, 0, true).X - 1, dgv.GetCellDisplayRectangle(5, 0, true).Y - 1, totalWidth, dgv.GetCellDisplayRectangle(5, 0, true).Height ); e.Graphics.FillRectangle(Brushes.AliceBlue, rect); e.Graphics.DrawRectangle(new Pen(dgv.GridColor), rect); var stringFormat = new StringFormat(); stringFormat.Alignment = StringAlignment.Center; stringFormat.LineAlignment = StringAlignment.Center; e.Graphics.TextRenderingHint = TextRenderingHint.ClearTypeGridFit; e.Graphics.DrawString("2000/01/01", dgv.Font, Brushes.Black, rect, stringFormat); }; |
***
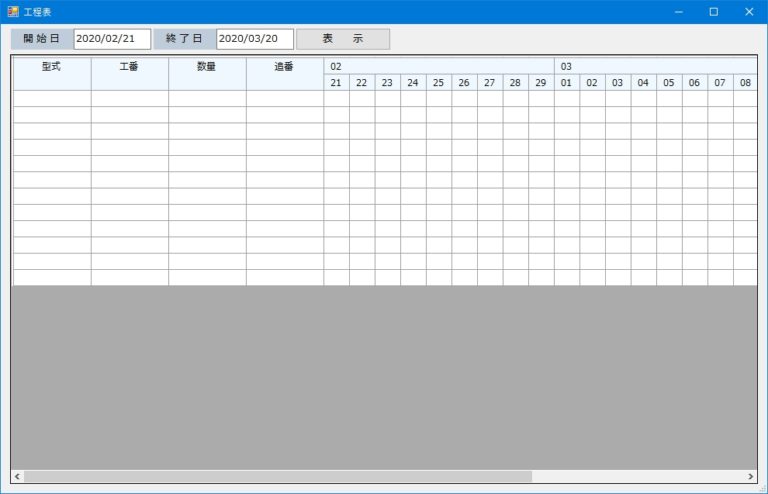
色々考えたけど、結局、Rectangleの擬似的結合は止めて、CellPainting()では罫線だけ処理した。Alignmentで中央にできないし長い文字列も設定できないが、描画落ちするよりはいいかなという感じ。

|
1 2 3 4 5 6 7 8 9 10 11 12 13 14 15 16 17 18 19 |
DataGridView.CellPainting += (s, e) => { if (e.RowIndex != 0) return; if (e.ColumnIndex < _StartDateColumn) e.AdvancedBorderStyle.Bottom = DataGridViewAdvancedCellBorderStyle.None; if (e.ColumnIndex >= _StartDateColumn) { e.AdvancedBorderStyle.Left = DataGridViewAdvancedCellBorderStyle.None; e.AdvancedBorderStyle.Right = DataGridViewAdvancedCellBorderStyle.None; if (e.ColumnIndex < DataGridView.Columns.Count - 1 && Convert.ToString(DataGridView.Rows[0].Cells[e.ColumnIndex + 1].Value) != "") { e.AdvancedBorderStyle.Right = DataGridViewAdvancedCellBorderStyle.Single; } } }; |
***
数日後追記。
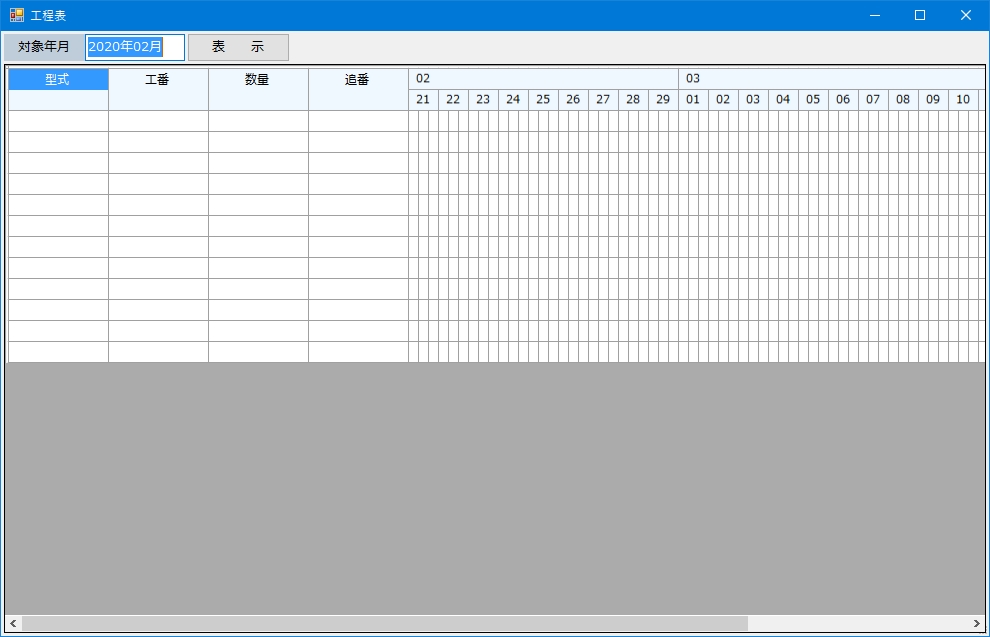
しばらく経ってから思いついたのが画像を利用するアイデアで、疑似的結合のサイズで動的に画像を生成して、それぞれのセルのサイズで抜き出して描画するという方法。
これだと見た目は結合されているけど、描画はセルごとなので黒塗りになってしまう問題も発生しない。
ただこの方法の場合、疑似的結合の範囲やサイズが固定なら問題ないけど、範囲やサイズが動的に変化するような仕様だとかなり複雑になってしまう。

|
1 2 3 4 5 6 7 8 9 10 11 12 13 14 15 16 17 18 19 20 21 22 23 24 25 26 27 28 29 30 31 32 33 34 35 36 37 38 39 40 41 42 43 44 45 46 47 48 49 50 51 52 53 54 55 56 57 58 59 60 61 62 63 64 65 66 67 68 69 70 71 72 73 74 75 76 77 78 79 80 81 82 83 84 85 86 87 88 89 90 91 92 93 94 95 96 97 98 99 100 101 102 103 104 105 106 107 108 109 110 111 112 113 114 115 116 117 118 119 120 121 122 123 124 125 126 127 128 129 130 131 132 133 134 135 136 137 138 139 140 141 142 143 144 145 146 147 148 149 150 151 152 153 154 155 156 157 158 159 160 161 162 163 164 165 166 167 168 169 170 171 172 173 174 175 176 177 178 179 180 181 182 183 184 185 186 187 188 189 190 191 192 193 194 195 196 197 198 199 200 201 202 203 204 205 206 207 208 209 210 211 212 213 214 215 216 217 218 219 220 221 222 223 224 225 226 227 228 229 230 231 232 233 234 235 236 237 238 239 240 241 242 243 244 245 246 247 248 249 250 251 252 253 254 255 256 257 258 259 260 261 262 263 264 265 266 267 268 269 270 271 272 273 274 275 276 277 278 279 280 281 282 283 284 285 286 287 288 289 290 291 292 293 294 295 296 297 298 299 300 301 302 303 304 305 306 307 308 309 310 311 312 313 314 315 316 317 318 319 320 321 322 323 324 325 326 327 328 329 330 331 332 333 334 335 336 337 338 339 340 341 342 343 344 345 346 347 348 349 350 351 352 353 354 355 356 357 358 359 360 361 362 363 364 365 366 367 368 369 370 371 372 373 374 375 376 377 378 379 380 381 382 383 384 385 386 387 388 389 390 |
using System; using System.Collections.Generic; using System.ComponentModel; using System.Data; using System.Drawing; using System.Drawing.Text; using System.Linq; using System.Text; using System.Threading.Tasks; using System.Windows.Forms; namespace ProductionManagement { public partial class GanttChart : Form { private int _StartDateColumn = 5; private int _DateColumnWidth = 13; private DateClass _DateClass = new DateClass(); private Bitmap[] _BitmapArray = new Bitmap[32]; public GanttChart() { InitializeComponent(); Binding(); InitializeTextBox(); CreateDataGridView(); SetupDataGridView(); AttachEvent(); CreateBitmap(); } private void InitializeTextBox() { DateTime ym = DateTime.Now; if (ym.Day <= 20) ym = ym.AddMonths(-1); _DateClass.年月 = ym.ToString("yyyy年MM月"); TargetYm.Text = ym.ToString("yyyy年MM月"); } private void Binding() { TargetYm.DataBindings.Add("Text", _DateClass, "年月"); } private void CreateBitmap() { for (int i = 1; i <= 31; i++) { var label = new Label() { Text = i.ToString().PadLeft(2, '0'), Width = _DateColumnWidth * 3, Height = DataGridView.RowTemplate.Height, Font = DataGridView.Font, TextAlign = ContentAlignment.MiddleCenter, BackColor = Color.AliceBlue }; var bitmap = new Bitmap(label.Width, label.Height); label.DrawToBitmap(bitmap, label.Bounds); _BitmapArray[i] = bitmap; } } private void DrawBorder(object s, DataGridViewCellPaintingEventArgs e) { var refer = Convert.ToString(DataGridView.Rows[1].Cells[e.ColumnIndex].Value); if (refer != "") { e.AdvancedBorderStyle.Left = DataGridViewAdvancedCellBorderStyle.OutsetDouble; // DrawLine()ではrightが上手く表示できない。 // DividerWidthではヘッダー部分まで描画されてしまう。 } } private void DrawMergeImage(object s, DataGridViewCellPaintingEventArgs e) { // 画像上で切り取る位置(X,Y)とサイズを指定する。 // ここでは生成済のWidth*3の画像があり、その画像上での位置とサイズを指定する。 var src = new Rectangle( 0, 0, e.CellBounds.Width, e.CellBounds.Height ); // フォーム上で描画する位置を指定する。 var dst = new Rectangle( e.CellBounds.X, e.CellBounds.Y, e.CellBounds.Width, e.CellBounds.Height - 1 ); var refer = Convert.ToString(DataGridView.Rows[e.RowIndex].Cells[e.ColumnIndex].Value); var referMinus1 = Convert.ToString(DataGridView.Rows[e.RowIndex].Cells[e.ColumnIndex - 1].Value); var referMinus2 = Convert.ToString(DataGridView.Rows[e.RowIndex].Cells[e.ColumnIndex - 2].Value); if (refer != "") { e.Graphics.DrawImage(_BitmapArray[int.Parse(refer)], dst, src, GraphicsUnit.Pixel); e.Graphics.DrawLine(new Pen(DataGridView.GridColor), // left e.CellBounds.X - 1, e.CellBounds.Y, e.CellBounds.X - 1, e.CellBounds.Y + e.CellBounds.Height // leftとrightの罫線が重複しているが、leftだけだとクリックしたときに罫線がなくなってしまう ); e.Graphics.DrawLine(new Pen(DataGridView.GridColor), // top e.CellBounds.X, e.CellBounds.Y - 1, e.CellBounds.X + e.CellBounds.Width, e.CellBounds.Y - 1 ); e.Graphics.DrawLine(new Pen(DataGridView.GridColor), // bottom e.CellBounds.X, e.CellBounds.Y + e.CellBounds.Height - 1, e.CellBounds.X + e.CellBounds.Width, e.CellBounds.Y + e.CellBounds.Height - 1 ); e.Handled = true; } else if (referMinus1 != "") { src.X = e.CellBounds.Width; e.Graphics.DrawImage(_BitmapArray[int.Parse(referMinus1)], dst, src, GraphicsUnit.Pixel); e.Graphics.DrawLine(new Pen(DataGridView.GridColor), // top e.CellBounds.X, e.CellBounds.Y - 1, e.CellBounds.X + e.CellBounds.Width, e.CellBounds.Y - 1 ); e.Graphics.DrawLine(new Pen(DataGridView.GridColor), // bottom e.CellBounds.X, e.CellBounds.Y + e.CellBounds.Height - 1, e.CellBounds.X + e.CellBounds.Width, e.CellBounds.Y + e.CellBounds.Height - 1 ); e.Handled = true; } else if (referMinus2 != "") { src.X = e.CellBounds.Width + e.CellBounds.Width; e.Graphics.DrawImage(_BitmapArray[int.Parse(referMinus2)], dst, src, GraphicsUnit.Pixel); e.Graphics.DrawLine(new Pen(DataGridView.GridColor), // top e.CellBounds.X, e.CellBounds.Y - 1, e.CellBounds.X + e.CellBounds.Width, e.CellBounds.Y - 1 ); e.Graphics.DrawLine(new Pen(DataGridView.GridColor), // bottom e.CellBounds.X, e.CellBounds.Y + e.CellBounds.Height - 1, e.CellBounds.X + e.CellBounds.Width, e.CellBounds.Y + e.CellBounds.Height - 1 ); if (e.RowIndex == 1) { e.Graphics.DrawLine(new Pen(DataGridView.GridColor), // right e.CellBounds.X + e.CellBounds.Width - 1, e.CellBounds.Y, e.CellBounds.X + e.CellBounds.Width - 1, e.CellBounds.Y + e.CellBounds.Height ); } e.Handled = true; } } private void AttachEvent() { DataGridView.CellPainting += (s, e) => { if (e.RowIndex == 0 && e.ColumnIndex < _StartDateColumn) { e.AdvancedBorderStyle.Bottom = DataGridViewAdvancedCellBorderStyle.None; } if (e.RowIndex == 0 && e.ColumnIndex >= _StartDateColumn) { e.AdvancedBorderStyle.Left = DataGridViewAdvancedCellBorderStyle.None; e.AdvancedBorderStyle.Right = DataGridViewAdvancedCellBorderStyle.None; if (e.ColumnIndex < DataGridView.Columns.Count - 1 && Convert.ToString(DataGridView.Rows[0].Cells[e.ColumnIndex + 1].Value) != "") { e.AdvancedBorderStyle.Right = DataGridViewAdvancedCellBorderStyle.Single; } } if ((e.RowIndex == 0 || e.RowIndex == 1) && e.ColumnIndex >= _StartDateColumn) { DrawMergeImage(s, e); } if (e.RowIndex > 1 && e.ColumnIndex >= _StartDateColumn) { DrawBorder(s, e); } }; DataGridView.Scroll += (s, e) => { DataGridView.Refresh(); }; CreateChart.Click += (s, e) => CreateDataGridView(); DataGridView.SelectionChanged += (s, e) => { if (DataGridView.Rows.Count >= 2) { DataGridView.Rows[0].Selected = false; DataGridView.Rows[1].Selected = false; } }; DataGridView.RowPrePaint += (s, e) => { e.PaintParts &= ~DataGridViewPaintParts.Focus; }; } private void CreateDataGridView() { if (TargetYm.Text == "") return; DataGridView.Rows.Clear(); DataGridView.Columns.Clear(); DateTime ym = DateTime.Parse(TargetYm.Text); DateTime startDay = new DateTime(ym.Year, ym.Month, 21); ym = ym.AddMonths(1); DateTime endDay = new DateTime(ym.Year, ym.Month, 20); List<DataGridViewColumn> listColumn = new List<DataGridViewColumn>(); foreach (var e in new string[] { "ID", "型式", "工番", "数量", "追番" }) { listColumn.Add(new DataGridViewTextBoxColumn { Name = e, HeaderText = "" }); } while (startDay <= endDay) { listColumn.Add(new DataGridViewTextBoxColumn { Name = startDay.ToString("yyyy/MM/dd"), HeaderText = "", Width = _DateColumnWidth }); listColumn.Add(new DataGridViewTextBoxColumn { Width = _DateColumnWidth }); listColumn.Add(new DataGridViewTextBoxColumn { Width = _DateColumnWidth }); startDay = startDay.AddDays(1); } DataGridView.Columns.AddRange(listColumn.ToArray()); for (int i = 0; i < 2; i++) DataGridView.Rows.Add(""); for (int c = 0; c < listColumn.Count; c++) { if (c < _StartDateColumn) { DataGridView.Rows[0].Cells[c].Value = listColumn[c].Name; } else { if (listColumn[c].Name != "") { DateTime.TryParse(listColumn[c].Name, out DateTime result); DataGridView.Rows[1].Cells[c].Value = result.ToString("dd"); if (c == _StartDateColumn || result.ToString("dd") == "01") { DataGridView.Rows[0].Cells[c].Value = result.ToString("MM"); } } } } SetupRowColumn(); DataLoad(); } private void DataLoad() { DataGridView.Rows.Add(""); DataGridView.Rows.Add(""); DataGridView.Rows.Add(""); DataGridView.Rows.Add(""); DataGridView.Rows.Add(""); DataGridView.Rows.Add(""); DataGridView.Rows.Add(""); DataGridView.Rows.Add(""); DataGridView.Rows.Add(""); DataGridView.Rows.Add(""); DataGridView.Rows.Add(""); DataGridView.Rows.Add(""); } private void SetupRowColumn() { DataGridView.Columns["ID"].Visible = false; DataGridView.Rows[0].DefaultCellStyle.BackColor = Color.AliceBlue; DataGridView.Rows[1].DefaultCellStyle.BackColor = Color.AliceBlue; foreach (DataGridViewColumn c in DataGridView.Columns) c.SortMode = DataGridViewColumnSortMode.NotSortable; } private void SetupDataGridView() { DataGridView.RowHeadersWidthSizeMode = DataGridViewRowHeadersWidthSizeMode.DisableResizing; DataGridView.RowHeadersWidth = 4; DataGridView.ColumnHeadersHeightSizeMode = DataGridViewColumnHeadersHeightSizeMode.DisableResizing; DataGridView.ColumnHeadersHeight = 4; DataGridView.AllowUserToResizeColumns = false; //DataGridView.SelectionMode = DataGridViewSelectionMode.FullRowSelect; DataGridView.ColumnHeadersDefaultCellStyle.WrapMode = DataGridViewTriState.False; DataGridView.AutoSizeColumnsMode = DataGridViewAutoSizeColumnsMode.None; DataGridView.AutoSizeRowsMode = DataGridViewAutoSizeRowsMode.None; DataGridView.Font = new Font("メイリオ", 9); DataGridView.DefaultCellStyle.Alignment = DataGridViewContentAlignment.MiddleCenter; DataGridView.AllowUserToAddRows = false; DataGridView.MultiSelect = true; typeof(DataGridView). GetProperty("DoubleBuffered", System.Reflection.BindingFlags.Instance | System.Reflection.BindingFlags.NonPublic). SetValue(DataGridView, true, null); } } class DateClass { private string TargetYm; public object 年月 { set { try { var dt = DateTime.Parse(Convert.ToString(value)); TargetYm = dt.ToString("yyyy年MM月"); } catch { TargetYm = ""; } } get { return TargetYm; } } } } |